Mullaney on the Markets
DOGEing bullets
By Michael Mullaney | Director of Global Markets Research
Published March 2025
During February, the U.S. stock market succumbed to a series of controversial mandates emanating out of Washington, including the announcement of a series of tariffs on various imports to the United States, immigration/deportations, federal agency closures, Department of Government Efficiency (DOGE) related layoffs, and the threat of a March government shutdown, all of which helped trigger a 1.30% loss for the S&P 500 Index during the month.
A weaker-than-expected S&P Global U.S. Purchasing Managers’ Survey for Services, along with a drop in the Atlanta Fed’s GDPNow forecast (Q1 2025 GDP fell from an estimated 2.3% gain to a 1.5% contraction) sent bond prices higher and yields lower, with the Bloomberg U.S. Aggregate Bond Index finishing the month up 2.20%.
Year to date, the S&P 500 remains in positive territory with a gain of 1.44%, as does the Bloomberg U.S. Aggregate Bond Index with a 2.74% gain.
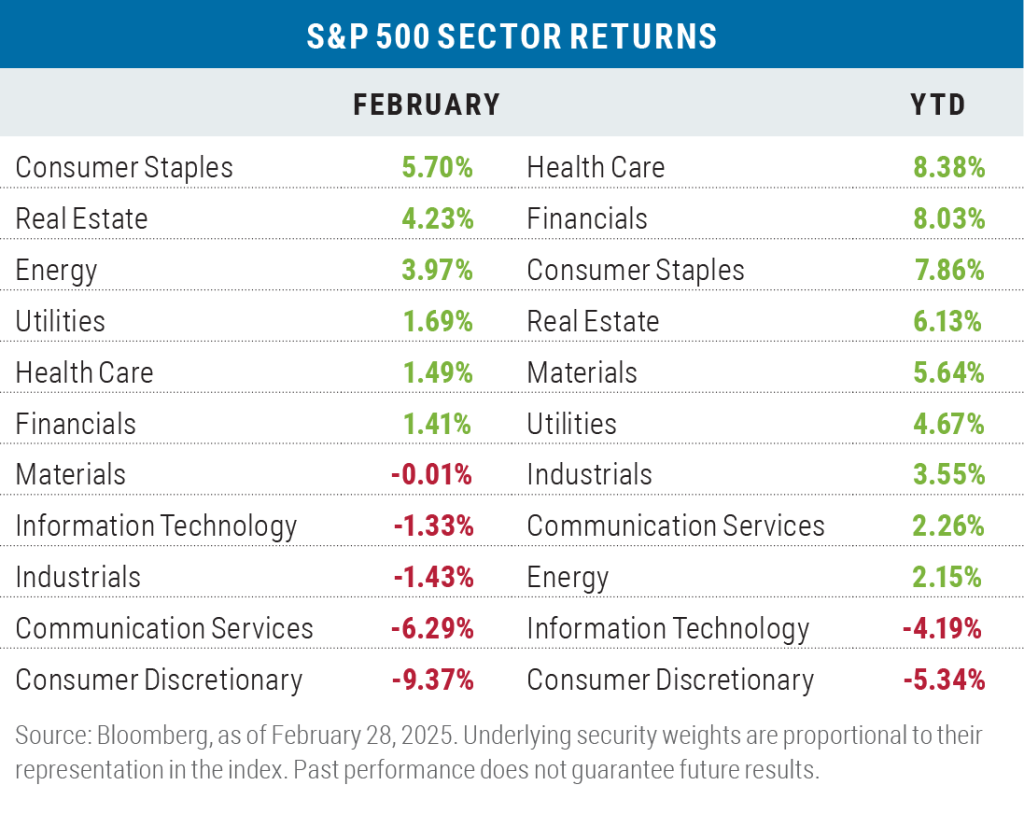
Mixed, but heavily skewed sector results for the month
Consumer Staples led all sectors during the month, largely on the strength of one stock, Philip Morris, which returned more than 19% and was responsible for 24% of the sector’s gains. The company reported better-than-expected results for fiscal year 2024 and guided higher for fiscal year 2025 as the company continues to shift towards smoke-free products.
The other consumer sector, Consumer Discretionary, trailed all sectors during February. Two stocks were responsible for 81% of the sector’s loss: Amazon, which dropped by more than 10%, and Tesla, which fell by almost 28%.
Amazon was hurt by the perception that demand for cloud storage centers may not fully materialize, while Tesla was hurt by a 45% drop in European sales in January due to increasing competition in the EV market from Volkswagen and other brands—and possibly as a result of pushback on Elon Musk’s political activism.
Communication Services also disappointed in February due almost entirely to one stock, Alphabet, which fell by an average of about 16% on a combined share class basis. The company is trying to fend off antitrust charges from the European Union against both its Google search engine and its Android operating system business segments.
Two trends continued to emerge over the early months of the year: A broadening of returns away from a handful of mega- cap tech stocks, and also a move towards more defensive sectors of the market.
Health Care has been a beneficiary of the pivot towards more defensive sectors and has also been helped by the strong year-to-date returns of five stocks: Gilead Sciences (+23.75%), Abbott Labs (+22.66%), Eli Lilly (+19.46%), Amgen (+19.16%), and AbbVie (+18.76%). Collectively, the five stocks are responsible for 64% of the overall return of the Health Care sector.
Meanwhile, the broadening of returns has helped Financials this year and, as in Health Care, five stocks have been significant contributors to the sector’s return: Visa (+14.96%), Berkshire Hathaway (+13.36%), Wells Fargo (+12.06%),
JPMorgan (+10.98%), and Mastercard (+9.61%). Collectively, these five stocks contributed a total of 61% of the sector’s return.
Also a sign of the broadening of returns: The S&P 500 Equal Weighted Index gained 2.87% year to date versus the 1.44% return posted by the benchmark’s traditional cap-weighted version.
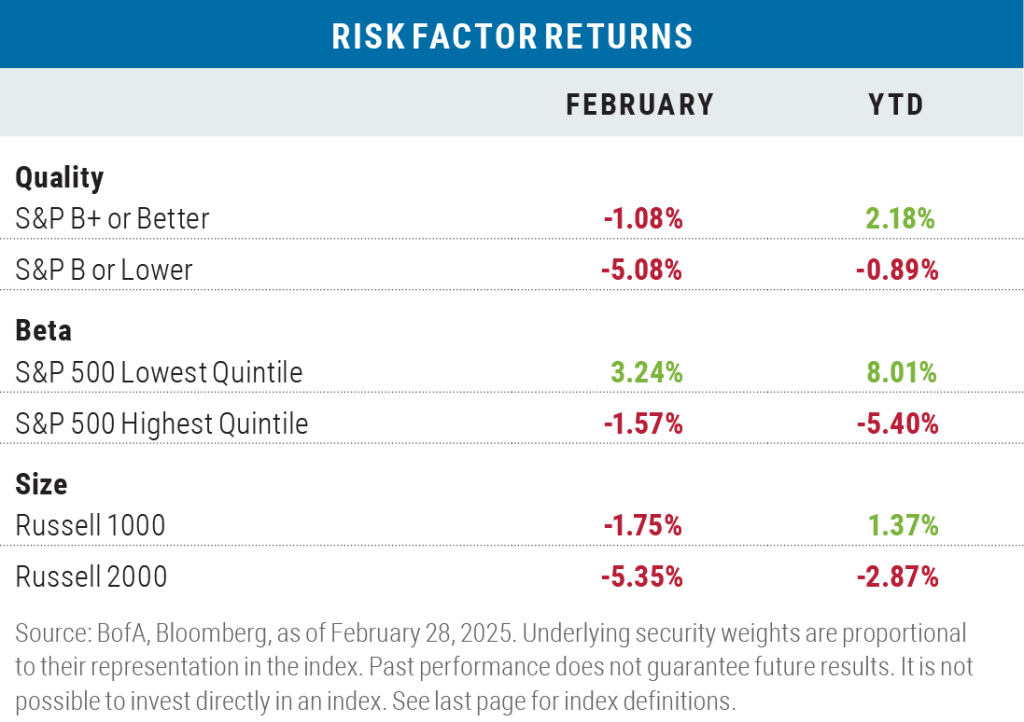
“Risk off” was clearly the signal for February and YTD
The “risk off” characteristics of high quality, low beta, and large size were the clear-cut winners in February. While low quality did prevail in January, its underperformance in February pulled it into the red on a year-to-date basis.
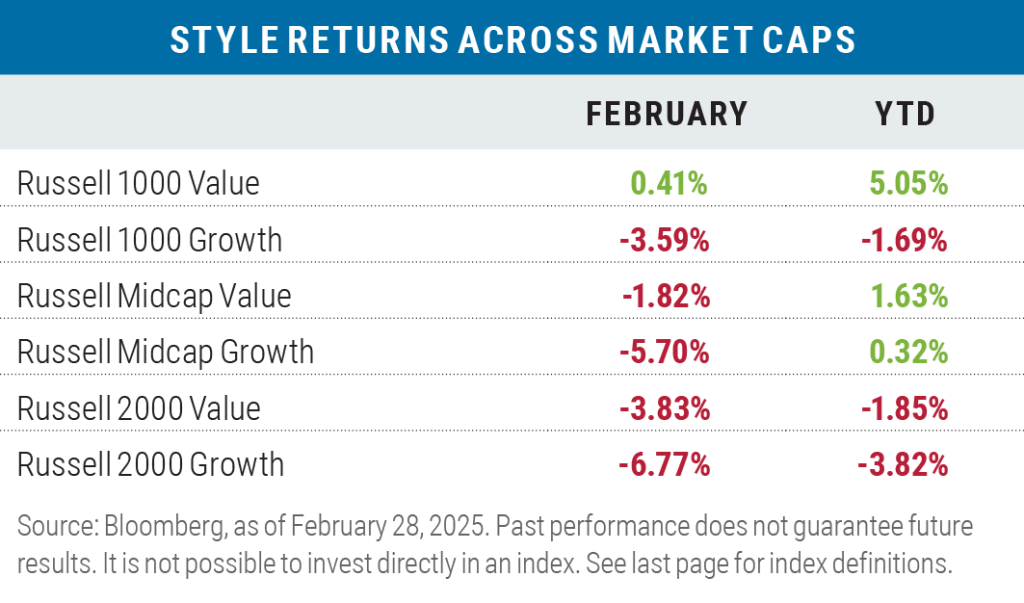
Value beat growth across all capitalization ranges during the month and YTD
In the large-cap space, three sectors were responsible for virtually all of the underperformance of the Russell 1000 Growth Index during February: Communication Services (down 10.02%), Consumer Discretionary (down 11.51%), and Information Technology (down 1.75%). Five of the Magnificent Seven stocks (all of which belong to those sectors) were significant culprits in the underperformance: Alphabet (which was off 16.39%), Meta Platforms (down 3.04%), Amazon (down 10.69%), Tesla (down 27.59%), and Microsoft (down 4.16%). Collectively, those five stocks were responsible for 98% of the underperformance of the Russell 1000 Growth Index versus the Russell 1000 Value Index during the month.
In the mid-cap space, the sectors contributing to the underperformance of the Russell Midcap Growth Index were somewhat different: Financials (down 7.34%), Industrials (down 5.12%), and Information Technology (down 4.81%) collectively contributed to 51% of the underperformance of mid-cap growth versus mid-cap value.
In small-caps, the underperformance of growth was more broad-based from a sector standpoint, though the Consumer Discretionary sector had a significant negative impact, posting a loss of 11.13% versus a drop of 4.74% for that sector in the Russell 2000 Value Index.
Year to date, the sectors that contributed to the underperformance of growth versus value were varied when looking across the cap spectrum (as measured by Russell indexes): in large caps, Information Technology was the main culprit (down 5.05%), in mid caps, it was Communication Services (down 7.89%), and in small caps, it was Consumer Discretionary (down 10.89%).
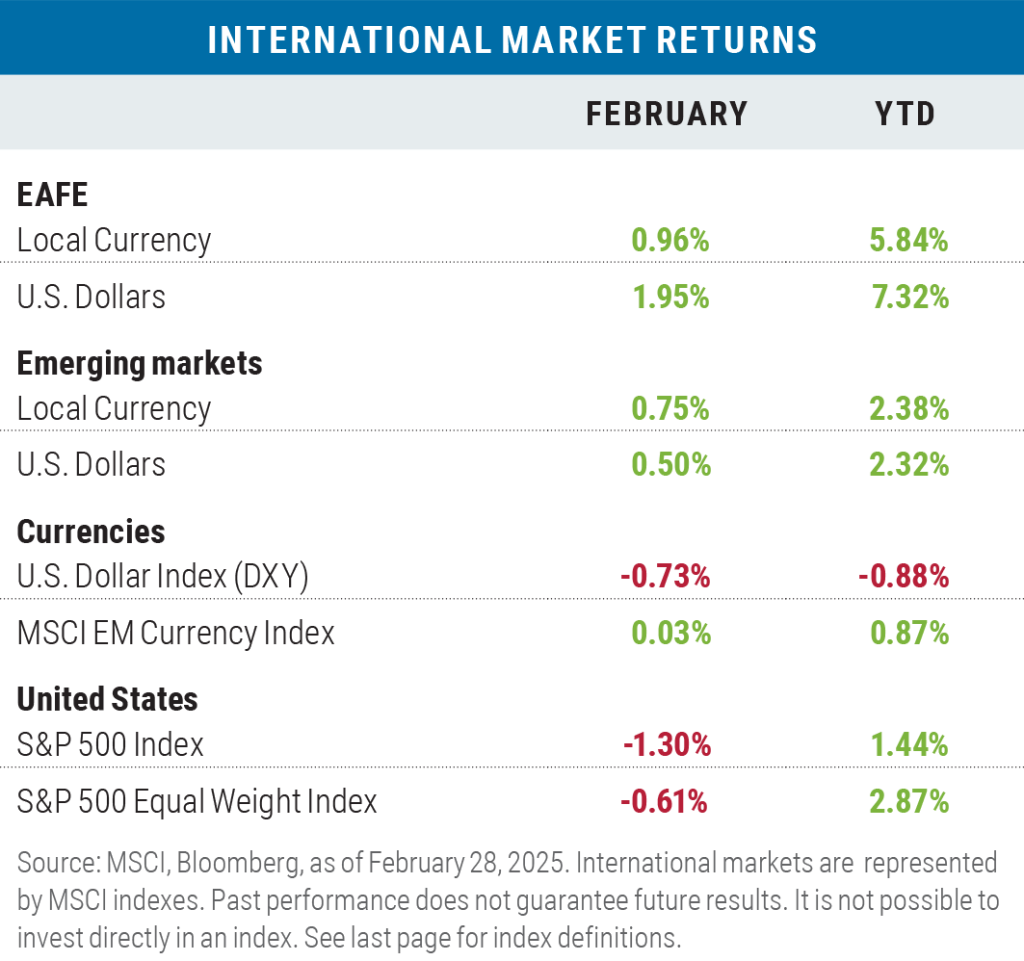
International stocks in both developed and emerging markets beat the S&P 500
Returns for developed market international stocks and emerging market stocks outpaced both the traditional capitalization-weighted and equal-weighted S&P 500 indexes in February, in both local currency terms and U.S. dollar terms; the greenback weakened during the month versus a basket of ten major developed market currencies and versus a basket of emerging market currencies. International stocks outperformed on a year-to-date basis as well, as investors worldwide continued to rotate out of past winners (think expensive tech giants) into regions, countries, and sectors with more attractive valuations.
Looking ahead
It seems more and more likely that for the stock, bond, and currency markets to find their footing, greater certainty is needed on at least three fronts: 1) A more clearly defined picture of what the global tariff situation will ultimately look like, 2) Congress agreeing to and passing a budget resolution that includes raising the debt ceiling, thereby avoiding a government shutdown, and 3) the signing of a peace agreement between Ukraine and Russia that all parties can stomach.
At this juncture, the likelihood of all three falling into place in the near term seems remote. The tariff situation alone is still highly volatile, given the unknowns regarding which countries will be targeted, to what degree, how they will respond, and what the ultimate economic consequences will be.
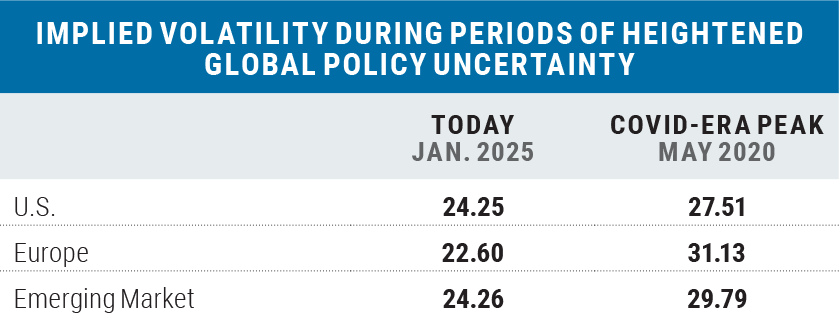
Given the current level of global economic uncertainty, stock market volatility still looks a little lower than one would expect.
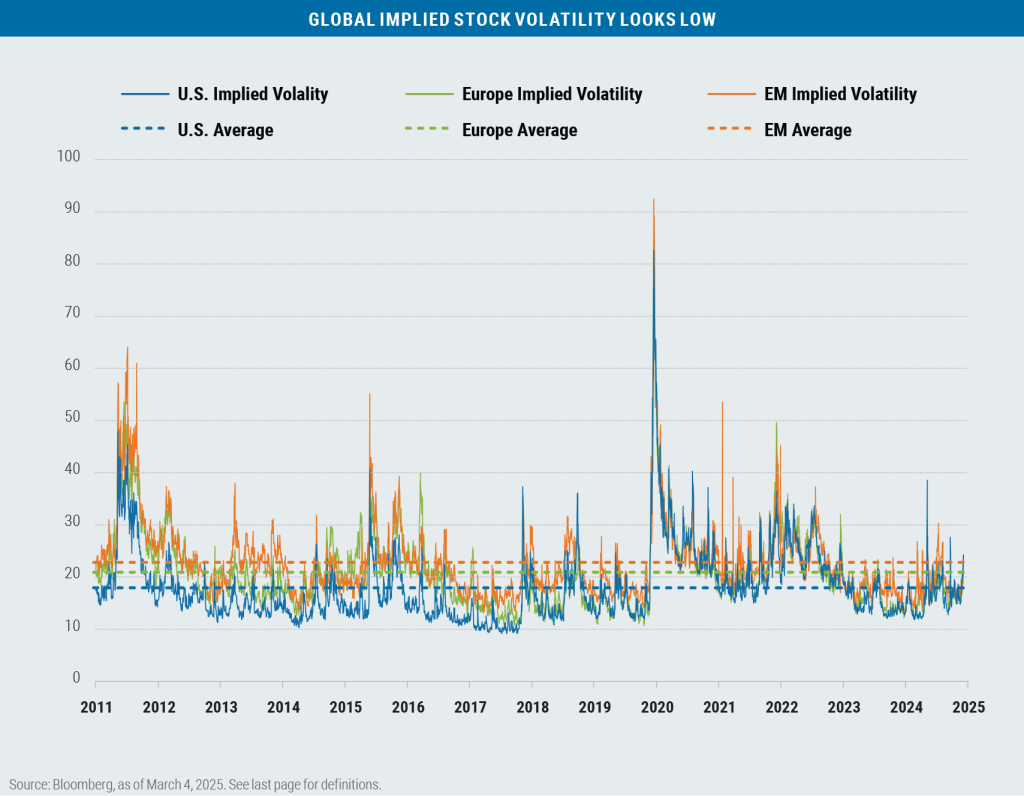
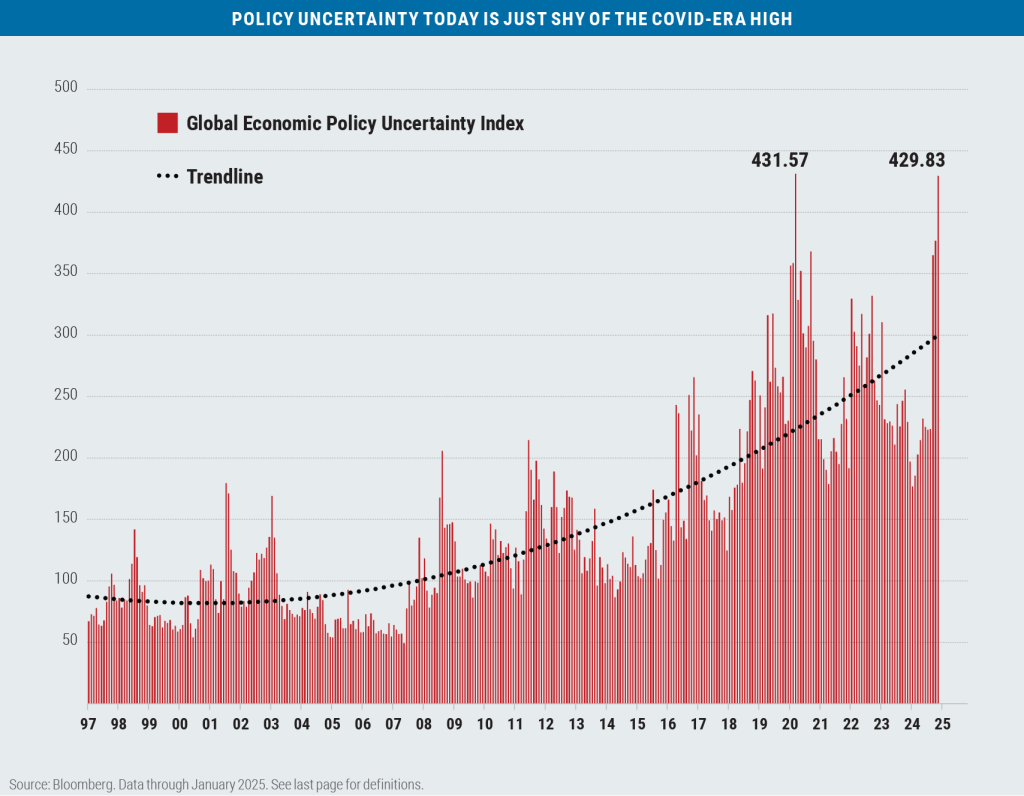
The last time the Global Economic Uncertainty Index was as high as today was in May of 2020 during the COVID outbreak. Investors should expect stock market volatility to remain high or increase even further.
7729984.1

Boston Partners Global Investors, Inc. (“Boston Partners”) is an investment adviser composed of two divisions, Boston Partners and Weiss, Peck & Greer Partners (“WPG”), and is an indirect, wholly owned subsidiary of ORIX Corporation of Japan (“Orix”). Boston Partners is affiliated with listed corporations through common ownership. ORIX Corporation Europe, N.V. services may be offered in the U.S. through Robeco Institutional Asset Management, U.S.
Boston Partners Global Investors, Inc. (“Boston Partners”) is an investment adviser registered with the SEC under the Investment Advisers Act of 1940. The views expressed in this commentary reflect those of the author as of the date of this commentary. Any such views are subject to change at any time based on market and other conditions and Boston Partners disclaims any responsibility to update such views. Past performance is not an indication of future results.
Discussions of securities, market returns, and trends are not intended to be a forecast of future events or returns. You should not assume that investments in the securities identified and discussed were or will be profitable.
Terms and definitions
Beta is a measure of a portfolio’s market risk relative to its benchmark. In general, a beta higher than 1.00 indicates a more volatile portfolio and beta lower than 1.00 indicates a less volatile portfolio in relation to its benchmark. The Bloomberg U.S. Aggregate Bond Index tracks the performance of intermediate-term investment-grade bonds traded in the United States. The Federal Reserve Bank of Atlanta’s GDPNow model provides a real-time estimate of GDP growth for the current quarter based on available economic data. The Global Economic Policy Uncertainty Index tracks the relative degree of uncertainty surrounding global economic policy based on newspaper articles from 21 countries, weighted by GDP. Implied volatility is a forward-looking measure of anticipated market volatility based on underlying options pricing. The MSCI Emerging Markets (EM) Currency Index tracks the performance of emerging market currencies relative to the U.S. dollar where the weight of each currency is equal to its country weight in the MSCI Emerging Markets Index. The MSCI EAFE Index tracks the performance of large- and mid-cap equities traded across global developed markets, excluding the United States and Canada. The MSCI Emerging Markets Index tracks the performance of large- and mid-cap equities traded in global emerging markets. The Russell 1000 Index tracks the performance of the 1,000 largest companies traded in the United States. The Russell 2000 Index tracks the performance of the 2,000 smallest companies traded in the United States. The Russell 1000 Growth and Value Indexes track the performance of those large-cap U.S. equities in the Russell 1000 Index with growth and value style characteristics, respectively. The Russell 2000 Growth and Value Indexes track the performance of those small-cap U.S. equities in the Russell 2000 Index with growth and value style characteristics, respectively. The Russell Midcap Growth and Value Indexes track the performance of those mid-cap U.S. companies in the Russell 1000 Index with growth and value style characteristics, respectively. The S&P 500 Index tracks the performance of the 500 largest companies traded in the United States. The S&P 500 Equal Weight Index also tracks the performance of the 500 largest companies traded in the United States, but weights each company equally, rather than proportionally according to market cap. S&P credit ratings, which range from AAA (highest) to D (default), are assigned by S&P Global to individual companies to indicate their relative creditworthiness. The S&P Global Purchasing Managers’ Index (PMI) is a survey-based economic indicator designed to provide information regarding prevailing business conditions. The services survey asks questions specific to service providers, as opposed to manufacturing companies. The U.S. Dollar Index (DXY) is used to measure the value of the dollar against a basket of six foreign currencies. The value of the index is a fair indication of the dollar’s value in global markets. It is not possible to invest directly in an index.
Market capitalization breakpoints
The breakpoints for capitalization ranges should be viewed only as guideposts and will change over time. In general, FTSE Russell (which maintains a number of stock-market indexes based on company size) considers small-cap stocks to have market caps of between $150 million and $7 billion, mid caps to have market caps between $7 billion and $150 billion, and large caps to be those companies with market caps above $150 billion.