Mullaney on the Markets
Stock market up again, but with a change in leadership
By Michael Mullaney | Director of Global Markets Research
Published August 2024
At first glance, the 1.22% return for the S&P 500 Index in July looks incredibly normal given that the average return for the index in July since WWII has been 1.21%. But a look under the surface tells a different story. From the 1st of the month through the 16th, the S&P 500 had gained 3.79%, driven by a combination of positive news on the inflation front and a surge in the probability of a Republican election win in November after the attempted assassination of Donald Trump.
The –0.1% month-over-month print for the CPI triggered what can only be described as a stampede into rate-sensitive small-cap stocks, with the Russell 2000 Index gaining 3.57% on the news (its biggest daily gain since November 2023) and rising 9.88% from the release until the end of the month (a return that lands in the top 2% of all 15-day gains for the index). Over that same 15-day period, the S&P 500 Index actually fell by 1.98%, hurt by a 9.39% loss for the “Magnificent 7” as investors sold those high-flyers to purchase stocks that would benefit the most from the highly anticipated cut (or cuts) in the Fed Funds rate.
Bonds followed suit, as interest rates fell by an average of 40 basis points for Treasury securities ranging from two to thirty years in maturity, which helped lift the Bloomberg U.S. Aggregate Bond Index to a gain of 2.34%, its best monthly return of the year. Year-to-date, the S&P 500 Index has returned 16.70%, while the Bloomberg U.S. Aggregate Bond Index has now crossed over into positive territory with a return of 1.61%.
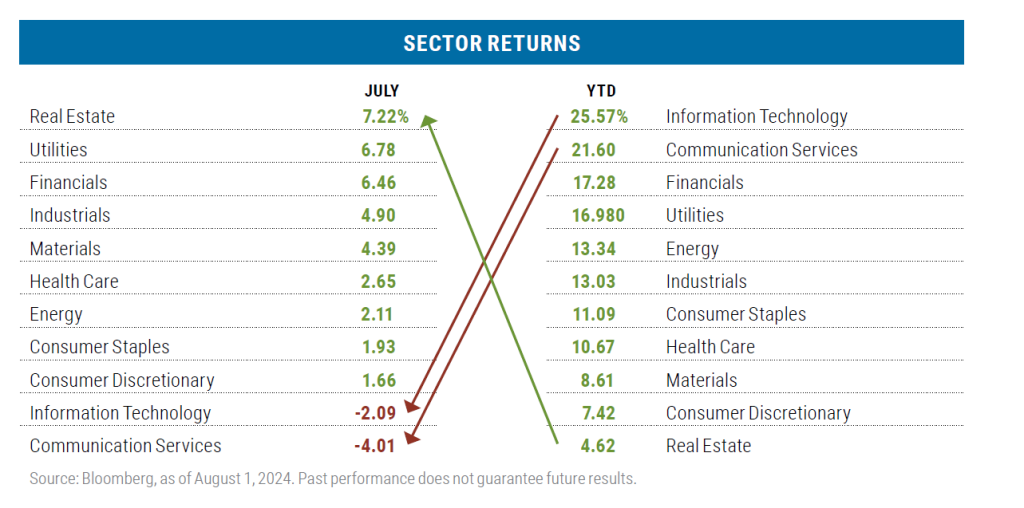
Leading sectors flipped during the month
The Communication Services and Information Technology sectors, which year-to-date had been the star performers, fell to the bottom of the barrel during July on profit taking, but also on concern over the cost/benefit of artificial intelligence-related spending, as only a limited number of companies have shown any increase in revenues and/or profits from their initial outlays— with chip-maker NVIDIA being the notable exception. In Communication Services, two companies were responsible for nearly 100% of the sector’s loss: Alphabet, which fell by 5.72%, and Meta, which lost 5.83%. In Information Technology, the culprits were Microsoft (-6.40%) and ironically NVIDIA, which fell by 5.28%. CrowdStrike whose software update caused worldwide operating system failures, dropped by 39.47% during the month, but it represented only 0.17% of the S&P 500 Index weight and therefore had minimal impact on the sector’s return.
In another reversal, Real Estate, which had struggled during the year in part due to high capital costs, took the pole position for returns during the month aided by the anticipation of lower interest rates and the increased likelihood of a Federal Reserve rate cut in September.

Large Cap Value
Our flagship U.S. equity strategy targeting attractively valued large-cap companies.
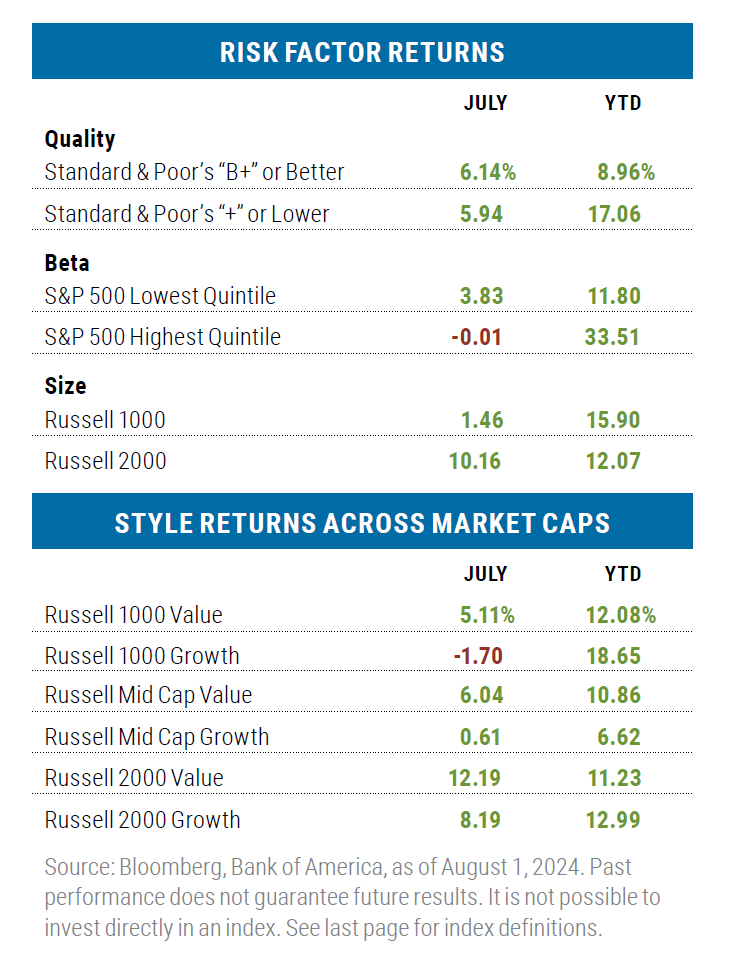
Results based on risk characteristics were mixed
July was more of a “risk off” month than “risk on,” except for the size factor, where small cap dominated. The year-to-date figures tell a different story, with “risk on” factors being more prevalent, except again for the size factor, as small caps continued to trail large caps even after July’s outlandish gain.
Within styles, value dominate growth in July
Value stocks beat growth stocks across all capitalization ranges during July with the average outperformance across the three capitalization ranges coming in at 5.42%, which is the best collective showing for value-style investing versus growth since May 2022.
For the full year, growth still leads value in the large- and small-cap space, but in mid caps, value maintains a sound lead over growth with the Health Care sector providing the biggest relative boost to the Russell Mid Cap Value Index, returning 2.55% vs. a loss of 4.86% for Health Care in the Russell Mid Cap Growth Index.
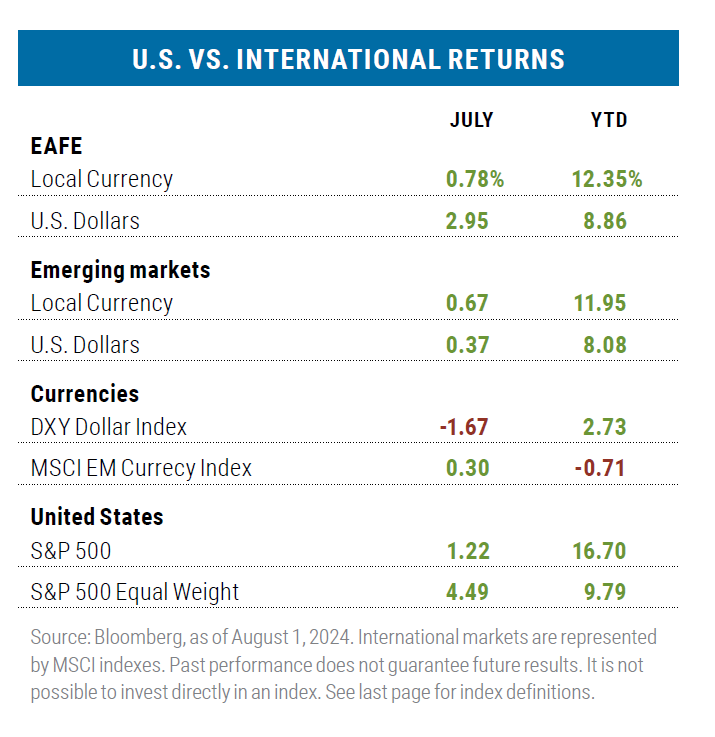
Non-U.S. stocks lagged
Returns for non-U.S. stocks, including both developed and emerging markets, lagged the S&P 500 on a cap-weighted and equal-weighted basis in July and over the year-to-date period. This was predominantly due to both greater exposure to and the better performance of technology stocks within the S&P 500.
The U.S. dollar’s strength throughout the year has also had a negative impact on non-U.S. stocks when measured in dollar terms, though dollar weakness in July against the six major currencies represented in the DXY Dollar Index gave a boost to the MSCI EAFE Index during the month. Much of the greenback’s weakness in July can be attributed to falling U.S. interest rates and the increased likelihood of the Fed’s pending transition to a new easing cycle.
Weaker economic data triggered market trepidation
While I usually limit my commentary to events that occured only in the reporting month, I believe it is important to recap what transpired on August 1st and 2nd in this edition. First was the release of the Institute of Supply Management report that showed U.S. manufacturing sliding deeper into contraction territory, including the sub-categories of new orders and employment. The second was the release of Nonfarm Payroll data for July; the 114,000 jobs created during the month were roughly 35% below the consensus estimate, while the unemployment rate, which was expected to hold steady at 4.1%, ticked up to 4.3%. These releases were on top of prior economic reports that had also come in below consensus estimates.
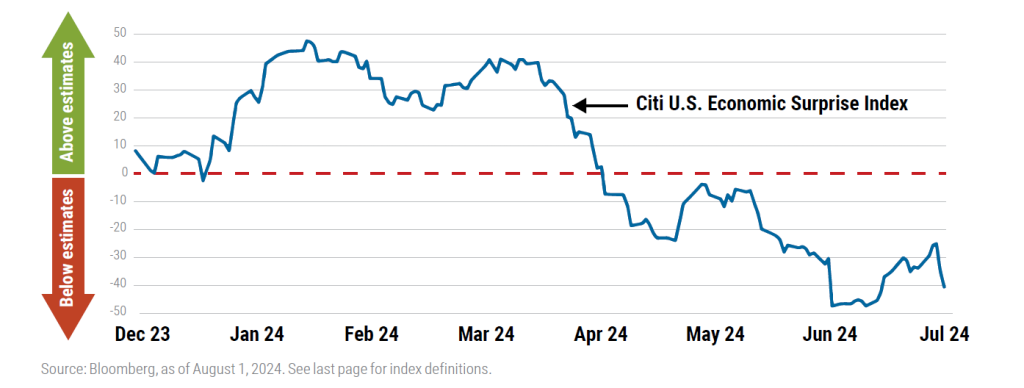
Together, these reports triggered a fear that perhaps the Federal Reserve had kept rates too high for too long, risking a hard landing for the U.S. economy. Markets responded quickly with Fed Funds futures immediately pricing in a 72% chance of a 50-basis-point rate cut by the Fed in September and the VIX Index of implied volatility for the S&P 500 jumping by 26% to a level not seen since the COVID pandemic. The bond market may also be sensing something is amiss, with the yield on the 10-Year Treasury falling nearly 50 basis points over the four weeks ending August 2nd.
Seasonal patterns may not help
Since WWII, August and September have been the only two months of the year when the S&P 500 Index has, on average, failed to produce a positive rate of return—though the loss for August has typically been minor at just 0.04%. Time will tell whether this is just a bout of “garden variety” deleveraging, or the beginning of something more sinister. Two important things to watch for that may indicate the latter: increasing unemployment and wider high-yield credit spreads.
6863231.1
Disclosures:
Boston Partners Global Investors, Inc. (“Boston Partners”) is an investment adviser registered with the SEC under the Investment Advisers Act of 1940. The views expressed in this commentary reflect those of the author as of the date of this commentary. Any such views are subject to change at any time based on market and other conditions and Boston Partners disclaims any responsibility to update such views. Past performance is not an indication of future results. Discussions of securities, market returns, and trends are not intended to be a forecast of future events or returns. You should not assume that investments in the securities identified and discussed were or will be profitable.
The views and opinions expressed may change based on market and other conditions. The views expressed reflect those of Boston Partners as of the date of publication. There can be no assurance that developments will transpire as forecasted.
Terms and definitions:
The Magnificent Seven stocks are a group of high-performing and influential companies in the U.S. stock market: Alphabet, Amazon, Apple, Meta Platforms, Microsoft, NVIDIA, and Tesla.
S&P 500 Index: The S&P 500 Index is a registered trademark of the McGraw-Hill Companies, Inc. and is an unmanaged Index of the common stocks of 500 widely held U.S. companies.
The S&P 1500, or S&P Composite 1500 Index, is a stock market index of US stocks made by Standard & Poor’s. It includes all stocks in the S&P 500, S&P 400, and S&P 600. This index covers approximately 90% of the market capitalization of U.S. stocks and is a broad measure of the U.S. equity market.
MSCI EAFE Index: International markets are represented by the MSCI EAFE (Europe, Australasia, Far East) Index. The MSCI EAFE Index is a free float-adjusted market capitalization index that is designed to measure the equity market performance of developed markets, excluding the US & Canada.
MSCI EM (Emerging Markets) Index: Captures large and mid cap representation across emerging markets countries covering approximately 85% of the free float-adjusted market capitalization in each country.
Russell 2000 Value Index: The Russell 2000 Index measures the performance of the 2,000 smallest companies in the Russell 3000 Index. The Russell 2000 Value Index contains stocks included in the Russell 2000 Index displaying low price-tobook ratios and low forecasted growth values.
Russell 2000 Growth Index: Russell 2000 Growth Index measures the performance of stocks in the Russell 2000 Index that display higher price-to-book ratios, higher earnings forecasts, and higher sales-per-share growth.
Russell 2000 Index: The Russell 2000 Index measures the performance of the 2,000 smallest companies in the Russell 3000 Index.
Russell 1000 Value Index: Measures the performance of those Russell 1000 companies with lower price-to-book ratios and lower forecasted growth values.
Russell 1000 Growth Index: Measures the performance of the large cap growth segment of the U.S. equity universe. It includes those Russell 1000 companies with relatively higher price-to-book ratios, higher I/B/E/S forecast medium term (2 year) growth and higher sales per share historical growth (5 years).
The Russell Midcap Value Index: The Russell Midcap Value Index measures the performance of stocks included among the 800 smallest companies in the Russell 1000 Index that display low price-to-book ratios and low forecasted growth values.
The Russell Midcap Growth Index: The Russell Midcap Growth Index measures the performance of stocks included among the 800 smallest companies in the Russell 1000 Index that display higher price-to-book ratios, higher earnings forecasts, and higher sales-per-share growth.
Bloomberg US Aggregate Bond: The Bloomberg USAgg Index is a broad-based flagship benchmark that measures the investment grade, US dollar-denominated, fixed-rate taxable bond.
U.S. Dollar Index (DXY): The U.S. Dollar Index is used to measure the value of the dollar against a basket of six foreign currencies. The value of the index is a fair indication of the dollar’s value in global markets.
The Citigroup U.S. Economic Surprise Index reflects the difference between the consensus forecasts for a basket of economic data and the actual results. Positive values indicate economic data that exceeded expectations; negative values reflect results below expectations.
Core Personal Consumption Expenditures Price Index (Core PCE): A measure of prices that people living in the United States, or those buying on their behalf, pay for goods and services. It’s sometimes called the core PCE price index, because two categories that can have price swings – food and energy – are left out to make underlying inflation easier to see.
CPI (Consumer Price Index): The CPI is a measure of the average change over time in the prices paid by urban consumers for a market basket of consumer goods and services. Indexes are available for the U.S. and various geographic areas. Average price data for select utility, automotive fuel, and food items are also available.
Beta: A measure of a portfolio’s market-related risk or its price movement in relation to a benchmark. Securities with betas higher than 1.0 have been, and are expected to be, more volatile than the benchmark; securities with betas lower than 1.0 have been, and are expected to be less volatile than the benchmark.
Credit ratings: Bond credit ratings are measured on a scale that generally ranges from AAA (highest) to D (lowest).