Mullaney on the Markets
A beehive of activity
By Michael Mullaney | Director of Global Markets Research
Published February 2025
A flurry of executive orders by President Donald Trump, a “hawkish hold” by the Federal Reserve, and an unforeseen Chinese challenge to the United States’ lead in the development of artificial intelligence failed to sidetrack the U.S. stock market in January as the S&P 500 gained 2.78%. In a sign of a broadening of equity returns, the S&P 500 Equal-Weighted Index advanced by 3.50%, while the Bloomberg U.S. Aggregate Bond Index returned 0.53%, with interest rates remaining largely unchanged during the month.
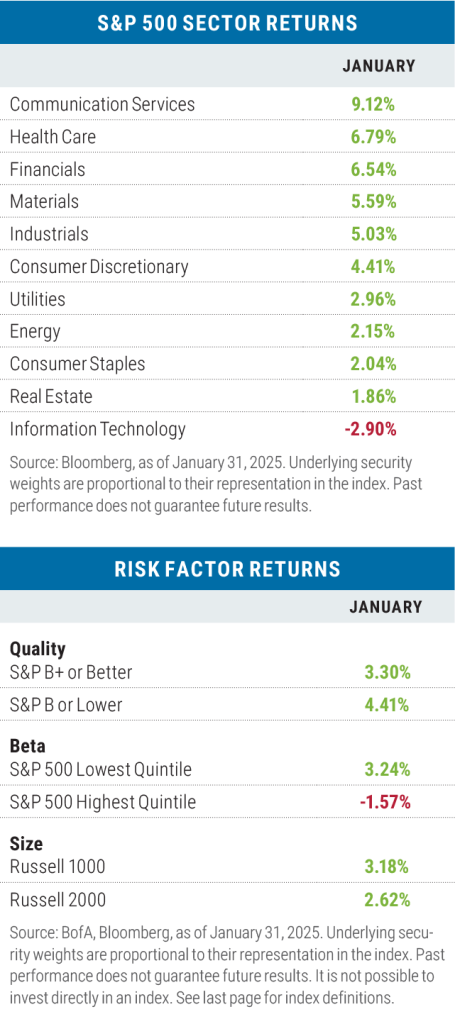
All but one sector showed gains for the month
Communication Services led all sectors during the month on the strength of Meta Platforms, which gained more than 17%. The sector contributed to 30% of the S&P 500’s overall return for the month while Meta Platforms was responsible for 53% of the sector’s return.
During the month, Meta reported Q4 earnings per share growth of $8.02 versus a consensus estimate of $6.77 on year-over-year revenue growth of 21%. While the company had banned Donald Trump from its platform following the January 6th riot on Capitol Hill, that ban was lifted in July 2024. Then in January, Meta CEO Mark Zuckerberg, after stating that the election felt like a “cultural tipping point,” announced a series of changes to the company’s moderation policies, the most prominent being the elimination of its fact-checking program in favor of a “community notes” system similar to the program favored by Elon Musk on his X platform.
Despite the run up in the Communication Services sector, Technology pulled up the rear in January with a loss of 2.90%, hurt by a 6.09% decline in the semiconductor industry. Nvidia had the largest negative contribution after the stock fell by over 10%; it alone was responsible for 72% of the overall loss in the sector.
The sentiment fueling the Tech sector took a hit in January when the Chinese company DeepSeek, owned and funded by Chinese hedge fund High-Flyer and its billionaire co-founder Liang Wenfeng, unveiled a new (and free) artificial intelligence open-source large language application that either equaled or surpassed existing models like OpenAI’s ChatGPT and Google’s Gemini in a series of generative AI tests.
The platform was reportedly developed at a fraction of the cost of its rivals by utilizing lower-cost general processing unit microchips and training itself on preexisting and readily available language models. Barron’s magazine dubbed it “The AI Reset” and President Trump said it should be a “wake-up call” for America’s tech companies.
Risk factors were mixed in January
While low-beta stocks outperformed their high-beta counterparts and large-cap stocks beat small-cap stocks—typically a sign of a more “risk off” environment—low-quality stocks did better than high-quality stocks, which is usually considered more of a “risk on” indicator. This was largely due to the tech effect again, as many Information Technology companies carry high quality ratings, but succumbed to the overall price pressure exerted on the sector during the month.
Value versus growth was also mixed in January
While growth beat value in both the mid- and small-cap space, value beat growth in the large-cap segment. The outperformance of value among large caps was almost entirely due to the return differential in Information Technology, as the tech segment of the Russell 1000 Growth Index (which makes up more than 47% of the benchmark) fell by 3.36%, compared with a gain of 5.26% for the Russell 1000 Value Index technology holdings. Three stocks did the most damage to the Information Technology sector in the growth index: Apple (down 5.76%), Microsoft (down 1.53%) and Nvidia (down 10.59%). Collectively, those three stocks make up 69% of the Information Technology sector in the Russell 1000 Growth Index.
Developed-market stocks outperform the United States, while emerging markets lag
Returns for developed-market international stocks generally outpaced major U.S. benchmarks during January, both in local currency terms and in U.S. dollar terms, as the greenback weakened during the month versus a basket of ten major foreign currencies. The outperformance of the MSCI EAFE Index can largely be attributed to the return differential in technology (again!) as that sector in the EAFE Index gained 5.26% versus the loss of 2.90% in the S&P 500.
Emerging-market stocks lagged the U.S. markets, as countries with large trade surpluses with the United States underperformed amid fears of the Trump administration implementing new tariffs; China was down 2.79%, Malaysia was off by 5.01%, and the Philippines declined 8.95% in January.
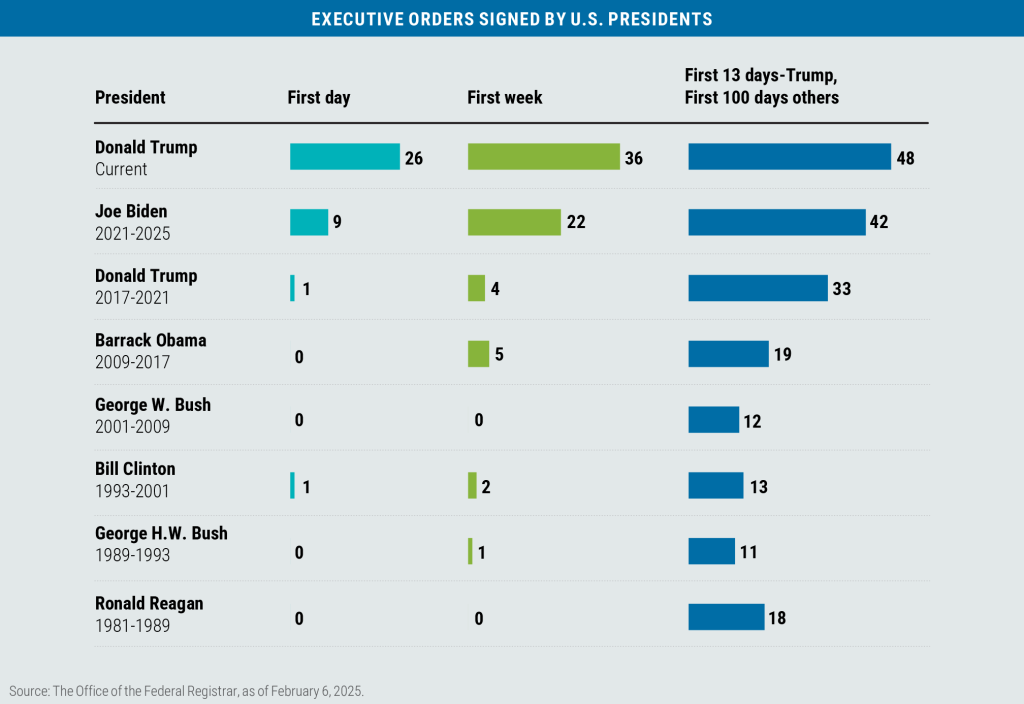
A diverse array of directions
In a whirlwind of activity, President Trump signed no fewer than 48 executive orders in his first 13 days in office with many targeting 1) immigration and deportations, 2) the unwinding of several of President Biden’s initiatives, particularly those related to green energy, and 3) new tariffs on Canada, Mexico, and China.
The tariffs initially proposed on the three countries (25% on Mexico; 25% on non-energy Canadian goods; 10% on Canadian energy; an additional 10% on China) would affect trade in goods worth about $1.3 trillion, which represents 43% of total U.S. imports and about 5% of U.S. GDP.
Investors seem to be viewing the moves with some degree of skepticism: From January 21 (Trump’s first full day in office) to February 3, the S&P 500 fell by 0.88%, though in fairness that loss also incorporated the 1.46% drop for the S&P 500 on January 27 when the DeepSeek news was announced. As of February 3, the S&P was down by 2.00% from the record high it hit on January 23.
Also weighing on the markets was the outcome of the Federal Reserve meeting—not so much because the Fed stayed pat on interest rates, which was widely anticipated, but because of wording that was eliminated in the official statement. The phrase from the Fed’s December statement (in red) was conspicuously absent from its January release: “Inflation has made progress toward the Committee’s 2 percent objective but remains somewhat elevated.” The effect of overtly stating that “inflation remains somewhat elevated”—without couching the statement in the context of any progress made—pushed out both the timing and the level of anticipated fed funds rate cuts in the financial futures market.
That said, S&P 500 Q4 earnings season releases helped to put a floor on potential losses for the index; as of January 31, 163 of the S&P 500 companies (and 40% of the market capitalization) had reported 4Q results. Reported sales growth was up 4.9% with earnings growth of 11.3%, while positive surprises outweighed the negative in those categories by 1.0% and 5.8% respectively. Incorporating the expected earnings growth for those companies that have yet to report, the blended earnings growth rate for the S&P 500 for the fourth quarter is now 13.2%. For Q1 2025, analysts are projecting earnings growth of 10.1% and revenue growth of 4.8%.
Another potential positive for stocks comes from what is called the “January Effect.” Since World War II, when the S&P 500 records a positive return in January, the return for the full year has been positive 89.5% of the time with an average return annual return of 14.5%.
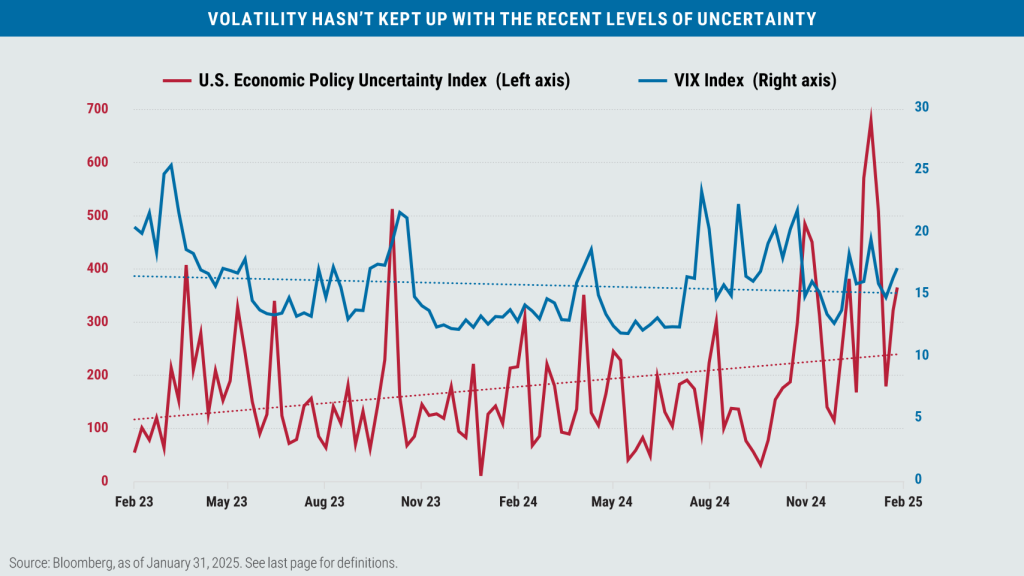
On a final note, given the increase in the U.S. Economic Policy Uncertainty Index (which is derived from the NewsBank Access World database of thousands of news sources), one would expect the VIX Index of implied S&P 500 volatility to increase from its current level. Instead, the VIX has remained relatively muted since the November elections. Time will tell if, and when, this trend reverses.
7621082.1

Boston Partners Global Investors, Inc. (“Boston Partners”) is an investment adviser registered with the SEC under the Investment Advisers Act of 1940.
The views expressed in this commentary reflect those of the author as of the date of this commentary. Any such views are subject to change at any time based on market and other conditions and Boston Partners disclaims any responsibility to update such views. Past performance is not an indication of future results. Discussions of securities, market returns, and trends are not intended to be a forecast of future events or returns. You should not assume that investments in the securities identified and discussed were or will be profitable.
The views and opinions expressed reflect those of Boston Partners as of the date of publication and may change based on market and other conditions.
There can be no assurance that developments will transpire as forecasted.
Terms and definitions
Beta is a measure of a portfolio’s market risk relative to its benchmark. In general, a beta higher than 1.00 indicates a more volatile portfolio and beta lower than 1.00 indicates a less volatile portfolio in relation to its benchmark.
The Bloomberg U.S. Aggregate Bond Index tracks the performance of intermediate-term investment-grade bonds traded in the United States. The CBOE Volatility Index (VIX) tracks the market’s expectations for volatility of the S&P 500 Index over the next 30 days based on the prices of underlying S&P 500 options contracts. The MSCI Emerging Markets (EM) Currency Index tracks the performance of emerging market currencies relative to the U.S. dollar where the weight of each currency is equal to its country weight in the MSCI Emerging Markets Index. The MSCI EAFE Index tracks the performance of large- and mid-cap equities traded across global developed markets, excluding the United States and Canada. The MSCI Emerging Markets Index tracks the performance of large- and mid-cap equities traded in global emerging markets. The Russell 1000 Index tracks the performance of the 1,000 largest companies traded in the United States. The Russell 2000 Index tracks the performance of the 2,000 smallest companies traded in the United States. The Russell 1000 Growth and Value Indexes track the performance of those large-cap U.S. equities in the Russell 1000 Index with growth and value style characteristics, respectively. The Russell 2000 Growth and Value Indexes track the performance of those small-cap U.S. equities in the Russell 2000 Index with growth and value style characteristics, respectively. The Russell Midcap Index tracks the performance of the roughly 800 smallest U.S. companies in the Russell 1000 Index. The Russell Midcap Growth and Value Indexes track the performance of those mid-cap U.S. companies in the Russell 1000 Index with growth and value style characteristics, respectively. The S&P 500 Index tracks the performance of the 500 largest companies traded in the United States. The U.S. Dollar Index (DXY) is used to measure the value of the dollar against a basket of six foreign currencies. The value of the index is a fair indication of the dollar’s value in global markets. It is not possible to invest directly in an index. U.S. Economic Policy Uncertainty Index tracks the relative degree of uncertainty surrounding U.S. economic policy by monitoring the frequency with which such topics are covered in major U.S. newspapers.
Market capitalization breakpoints The breakpoints for capitalization ranges should be viewed only as guideposts and will change over time. In general, FTSE Russell (which maintains a number of stock-market indexes based on company size) considers small-cap stocks to have market caps of between $150 million and $7 billion, mid caps to have market caps between $7 billion and $150 billion, and large caps to be those companies with market caps above $150 billion.