Mullaney on the Markets
Choppy waters ahead
By Michael Mullaney | Director of Global Markets Research
Published December 2024
The stock market reacted favorably to the results of the November U.S. elections that brought a red wave to Washington, with the Republican Party capturing the presidency and both chambers of Congress. For the month, the S&P 500 Index gained 5.87%, its best monthly return for the year, while bonds rebounded from an October loss to gain 1.06% as measured by the Bloomberg U.S. Aggregate Bond Index. Year-to-date, the S&P 500 advanced by 28.06%, its strongest performance since 2013, while also hitting 54 new highs along the way, the fifth-highest tally on record going back to 1954. For the year, the Bloomberg U.S. Aggregate Bond Index returned 2.93%, though a total coupon income of 3.36% was needed to compensate for the 0.43% principal loss due to the increase in interest rates this year.

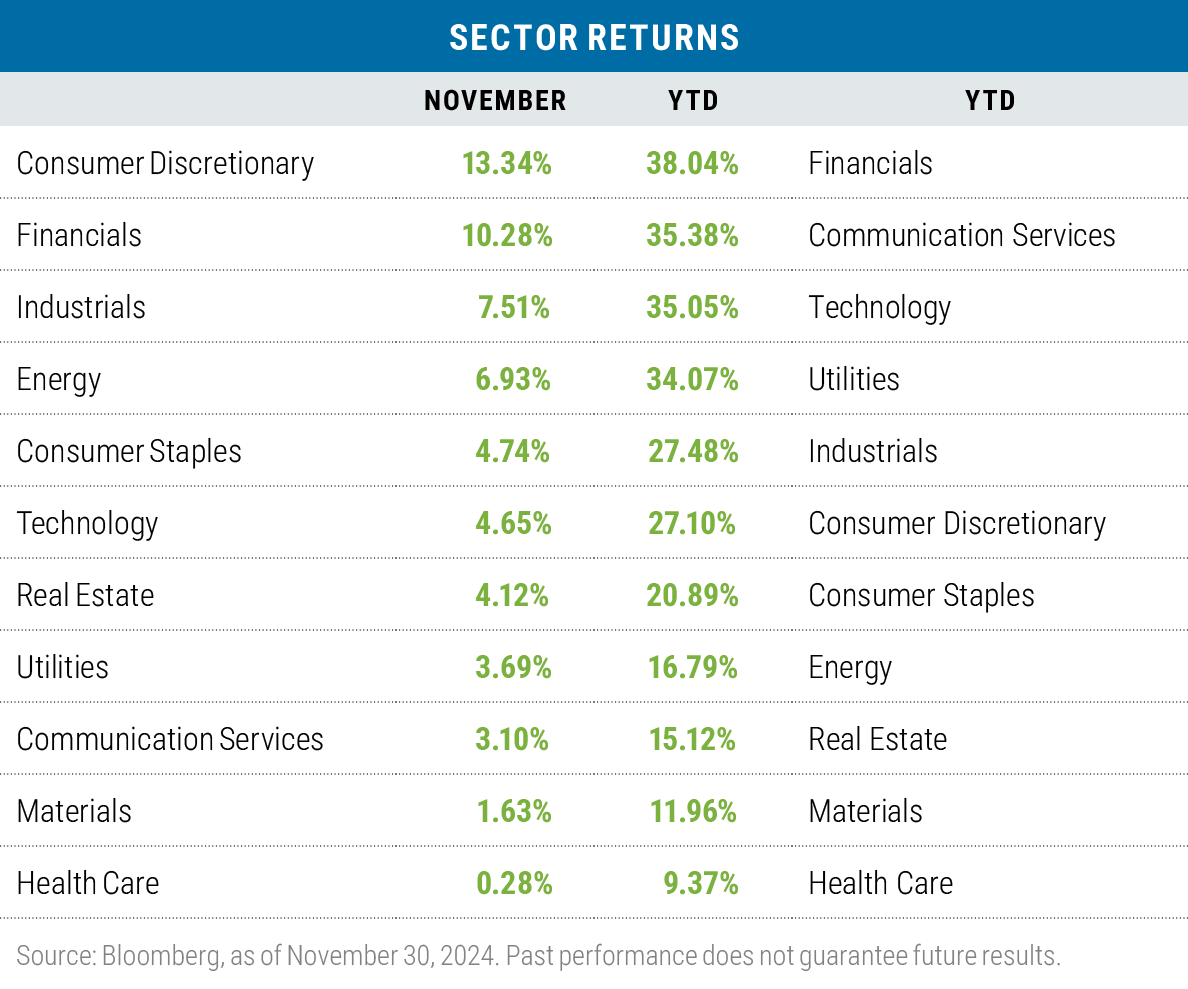
All sectors posted positive returns in November and year-to-date
The Consumer Discretionary sector led all other sectors in November, largely on the strength of Tesla, which gained more than 38% during the month and was responsible for 41% of the sector’s overall return. Several factors aided the stock: It beat Q3 earnings-per-share estimates by 21%; Elon Musk was named as the co-head of President-elect Donald Trump’s newly created Department of Government Efficiency; and the incoming administration presents the possibility of easing U.S. regulations for self-driving cars, which remains a big initiative for Tesla.
Financials was the next-best performer, also posting a double-digit return for the month driven in part by expectations of broad regulatory relief coming from the new administration.
The Health Care sector was the laggard in November, as Trump’s nomination of Robert F. Kennedy Jr. as secretary of the Department of Health and Human Services cast a pall over the sector, particularly for vaccine makers—Kennedy remains a skeptic of immunizations in general. Moderna was the biggest casualty, dropping by nearly 21% during the month.
Year-to-date, Financials regained the pole position on anticipated regulatory relief, but also due to higher interest rates and the disinversion of the yield curve, all of which bode well for future net interest margins.
Health Care remained in the cellar year-to-date as the sector continued to find itself under the microscope, with policymakers searching for fresh price cuts and exploring a possible renewed effort by the Trump administration to repeal the Affordable Care Act, also known as Obamacare.
Risk-on factors dominated in November
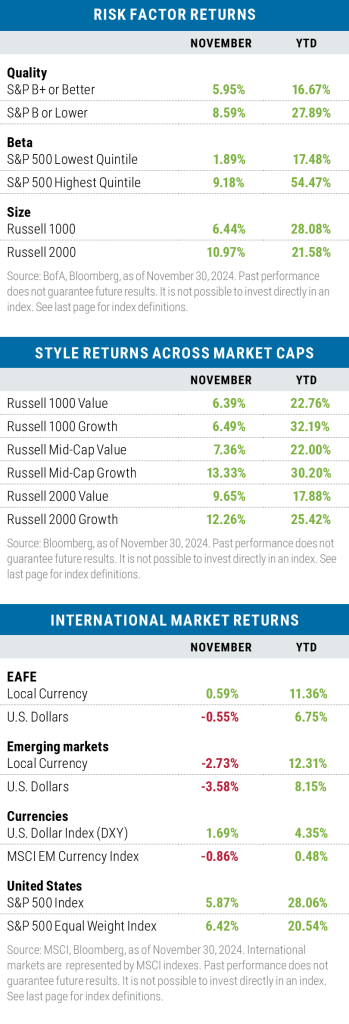
All three of the major risk factors we follow pointed to a risk-on environment for stocks in November: low-quality holdings beat high-quality, high-beta segments beat low-beta, and small-cap stocks beat large-cap stocks. Year-to-date, the results were more nuanced: While low-quality and high-beta segments outperformed, large-cap stocks beat their small-cap counterparts, largely due to the outperformance of mega-cap stocks like the Magnificent Seven, which returned more than 57% through November.
Large Cap Value
Our flagship U.S. equity strategy targeting attractively valued large-cap companies.

Growth continued to lead
Growth remained the dominant style factor in November across the three major capitalization ranges—though in the large-cap space, the return differential versus value was slight. Tesla aided the Russell 1000 Growth Index’s performance to the tune of 79 basis points, although that deficit was largely offset by the relative strength of the Russell 1000 Value Index’s holdings in the Communication Services, Financials, and Technology sectors.
Year-to-date, growth remained ahead of value by an average of 8.39% across the small-, mid-, and large-cap ranges, although one sector, Technology, was responsible for nearly 40% of the outperformance across the respective style benchmarks.
Non-U.S. stocks continued to struggle
Returns for both developed-market international stocks and emerging-market stocks lagged the S&P 500 in November in both local currency and U.S. dollar terms, as President-elect Trump’s campaign pledge to increase tariffs on all imports to the United States weighed heavily on results. Returns for Asian emerging-market countries that carry large trade surpluses with the United States were particularly weak, especially in U.S. dollar (USD) terms, with China dropping by 4.44%, Indonesia by 7.92%, and the Philippines by 8.48%.
Year-to-date, the story is much the same with both developed- and emerging-market bourses lagging the United States in local currency terms—and even more so in USD terms. The greenback’s recent strength has been mostly a product of the higher U.S. interest rate environment, a relatively more robust U.S. economy, and the dollar’s continued status as the preferred reserve currency across the globe.
Going back to 1801 and President John Adams, 31 cabinet post nominees have either been rejected by the Senate or have withdrawn their names from consideration. During his first term in office, President Trump had five cabinet nominees withdraw their names from consideration when it became apparent that they could not garner the Senate votes necessary for confirmation. With Trump “part deux,” one candidate, former Congressman Matt Gaetz, has already withdrawn his nomination for attorney general under a cloud of allegations of sexual misconduct and drug use. Three other Trump nominees face what is expected to be intense scrutiny in the Senate: Pete Hegseth for secretary of defense, Robert F. Kennedy Jr. for secretary of the Department of Health and Human Services, and Kash Patel for director of the FBI. While each candidate carries some personal baggage, the acid test for each will most likely boil down to whether they have the qualifications needed for the positions or not. The confirmation process is destined to make for good theater, including intense media coverage, which could in turn translate into heightened market volatility given the uncertain outcomes.
Several of President-elect Trump’s campaign pledges may also stoke market volatility as they begin to take shape, particularly those policies that entail perceived trade-offs. For example:- Lower taxes versus increased tariffs
- Deregulation versus deportations
The first of each is generally considered to be pro-growth, while the latter of each is believed to be a hindrance to growth. The details surrounding planning, funding, and implementation will be critical in determining how smoothly the processes unfold.
What to watch in DecemberThe Federal Open Market Committee will meet on December 17 and 18 to decide whether to continue lowering interest rates. Currently, the fed funds futures market is pricing in a 74% probability of a 25 basis-point cut in the fed funds rate, which would bring the total cuts this year to 1%. That said, there has been discussion in the media that no cut is a possibility given the recent lack of progress on reducing the Core Personal Consumption Expenditure (Core PCE) Price Index, which is the Fed’s preferred inflation measure. No action seems unlikely given that just a month ago Fed Chair Jerome Powell indicated that maintaining a strong labor market was at least as important (if not more important) than lowering inflation from current levels.
Meanwhile, at the end of September, Congress passed a continuing resolution bill that funds the U.S. government through December 20. To avoid the threat of a government shutdown, another short-term funding bill is expected to be introduced to Congress before then, with the objective of funding the government at least through March.
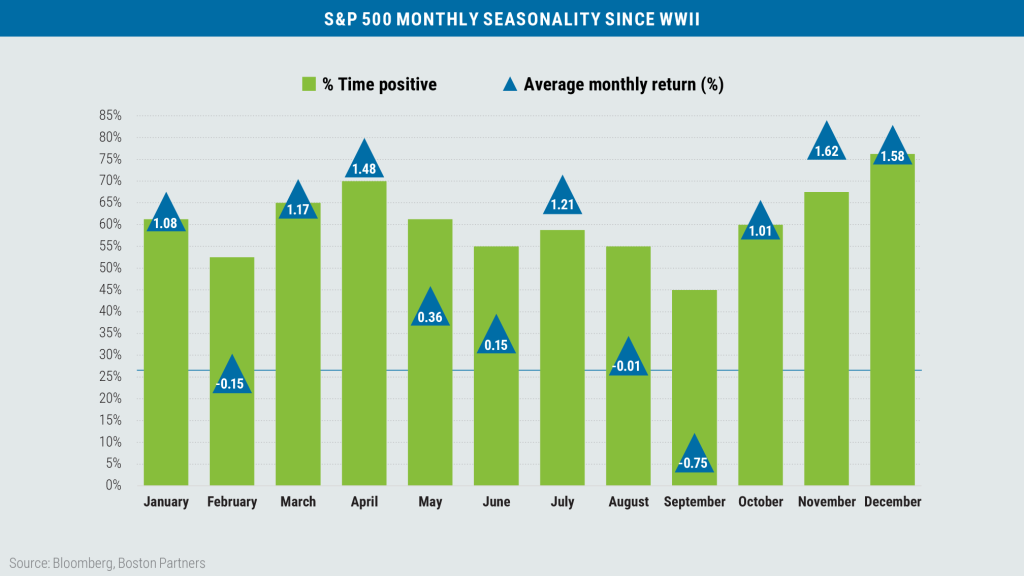
A Santa Claus rally ahead?Since WWII, December has produced a positive rate of return for the S&P 500 76% of the time, the highest of any month of the year, and has posted an average gain of 1.58%, the second-highest average return of any month.

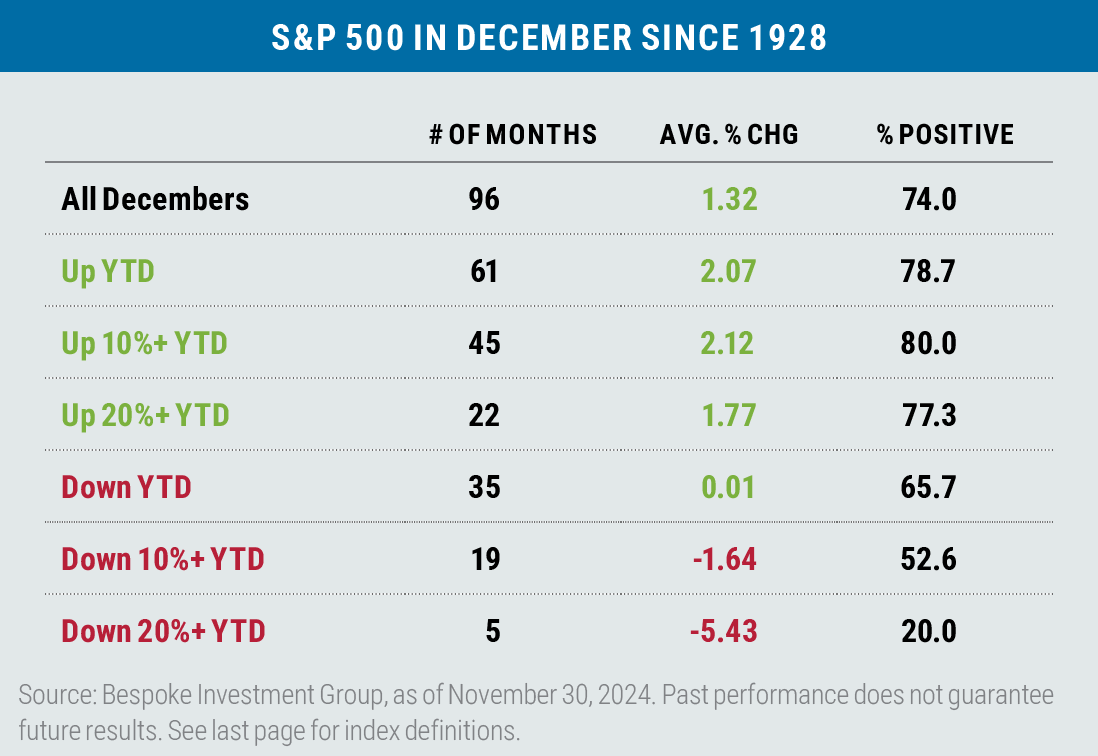
One of our research providers, Bespoke Investment Group, produced an analysis of S&P 500 seasonality performance going back to 1928 that also considers the return conditions of the index leading up to December, i.e., year-to-date performance through the end of November.

Historically, when the S&P 500 is up in excess of 20% through November (as was the case this year), December has produced a gain 77.3% of the time with an average return of 1.77%. It remains to be seen, however, whether this year’s stellar return of 5.87% in November will dampen December’s results.
7417352.1
Disclosures:
Boston Partners Global Investors, Inc. (“Boston Partners”) is an investment adviser registered with the SEC under the Investment Advisers Act of 1940.
The views expressed in this commentary reflect those of the author as of the date of this commentary. Any such views are subject to change at any time based on market and other conditions and Boston Partners disclaims any responsibility to update such views. Past performance is not an indication of future results. Discussions of securities, market returns, and trends are not intended to be a forecast of future events or returns. You should not assume that investments in the securities identified and discussed were or will be profitable.
The views and opinions expressed reflect those of Boston Partners as of the date of publication and may change based on market and other conditions. There can be no assurance that developments will transpire as forecasted.
Terms and definitions
Beta is a measure of a portfolio’s market risk relative to its benchmark. In general, a beta higher than 1.00 indicates a more volatile portfolio and beta lower than 1.00 indicates a less volatile portfolio in relation to its benchmark. Bond credit ratings are measured on a scale that generally ranges from AAA (highest) to D (lowest). Capital expenditures (CapEx) are investments made by a business to obtain or improve physical assets. The Magnificent Seven stocks are a group of high-performing and influential companies in the U.S. stock market: Alphabet, Amazon, Apple, Meta Platforms, Microsoft, NVIDIA, and Tesla.
The Bloomberg U.S. Aggregate Bond Index tracks the performance of intermediate-term investment-grade bonds traded in the United States. The Chicago Fed’s National Financial Conditions Index (NFCI) provides a comprehensive weekly update on U.S. financial conditions in money markets, debt and equity markets, and the traditional and “shadow” banking systems. Positive values of the NFCI indicate financial conditions that are tighter than average, while negative values indicate financial conditions that are looser than average. The MSCI Emerging Markets (EM) Currency Index tracks the performance of emerging market currencies relative to the U.S. dollar where the weight of each currency is equal to its country weight in the MSCI Emerging Markets Index. The MSCI EAFE Index tracks the performance of large- and mid-cap equities traded across global developed markets, excluding the United States and Canada. The MSCI Emerging Markets Index tracks the performance of large- and mid-cap equities traded in global emerging markets. The Russell 1000 Index tracks the performance of the 1,000 largest companies traded in the United States. The Russell 2000 Index tracks the performance of the 2,000 smallest companies traded in the United States. The Russell 1000 Growth and Value Indexes track the performance of those large-cap U.S. equities in the Russell 1000 Index with growth and value style characteristics, respectively. The Russell 2000 Growth and Value Indexes track the performance of those small-cap U.S. equities in the Russell 2000 Index with growth and value style characteristics, respectively. The Russell Midcap Index tracks the performance of the roughly 800 smallest U.S. companies in the Russell 1000 Index.
The Russell Midcap Growth and Value Indexes track the performance of those mid-cap U.S. companies in the Russell 1000 Index with growth and value style characteristics, respectively. The S&P 500 Index tracks the performance of the 500 largest companies traded in the United States. The U.S. Dollar Index (DXY)
is used to measure the value of the dollar against a basket of six foreign currencies. The value of the index is a fair indication of the dollar’s value in global markets. It is not possible to invest directly in an index.
Market capitalization breakpoints
The breakpoints for capitalization ranges should be viewed only as guideposts and will change over time. In general, FTSE Russell (which maintains a number of stock-market indexes based on company size) considers small-cap stocks to have market caps of between $150 million and $7 billion, mid caps to have market caps between $7 billion and $150 billion, and large caps to be those companies with market caps above $150 billion.


